
Product Dashboards
Feature usage, funnel, and retention views built for your product team.
We design and build the dashboard itself: the product, ops, or executive reporting interface your team opens to make decisions. This is different from instrumenting analytics events or packaging metrics for investors; here we build the charts, tables, and role-based views on top of data you already have.
Built for the specific audience and data each dashboard serves
Feature usage, funnel, and retention views built for your product team.
Real-time monitoring for queues, fulfillment, and operational error rates.
Revenue and growth metrics rolled up into a leadership-facing view.
Usage dashboards embedded directly inside your product for your own users.
Aggregation queries and materialized views built for dashboard-speed reads.
Scoped views and permissions so each role sees only what's relevant to them.
Charts built with Recharts or D3 when a BI tool's defaults aren't enough.
Slack or email alerts when a tracked metric crosses a defined line.

We query your production database or warehouse directly. There's no duplicate data store to keep in sync.

Metabase or Grafana is often faster and cheaper than a custom build for internal reporting. We recommend that when it fits, rather than defaulting to custom work.

Access control is designed into the data model, not bolted on as a UI-level filter a determined user could bypass.
We keep reporting queries away from your primary application database path so a heavy dashboard query never slows down your product.
We query your production database or warehouse directly. There's no duplicate data store to keep in sync.
Metabase or Grafana is often faster and cheaper than a custom build for internal reporting. We recommend that when it fits, rather than defaulting to custom work.
Access control is designed into the data model, not bolted on as a UI-level filter a determined user could bypass.
We keep reporting queries away from your primary application database path so a heavy dashboard query never slows down your product.
We've helped startups and enterprises worldwide transform their AI ideas into production-ready MVPs in 2–3 weeks. From fintech platforms to AI assistants, our global MVP development services have launched 18+ AI products serving users across the US, Europe, and Asia.





From content platforms and AI assistants to analytics dashboards and fintech solutions: see how we've transformed ideas into production-ready MVPs in 2-3 weeks across diverse industries. Each product launched successfully, serving users globally.
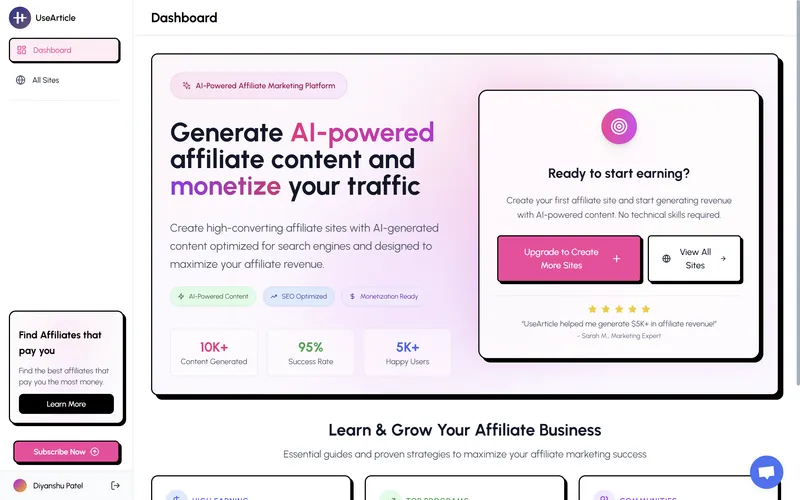
AI-powered content creation and management platform that helps teams produce high-quality articles at scale.
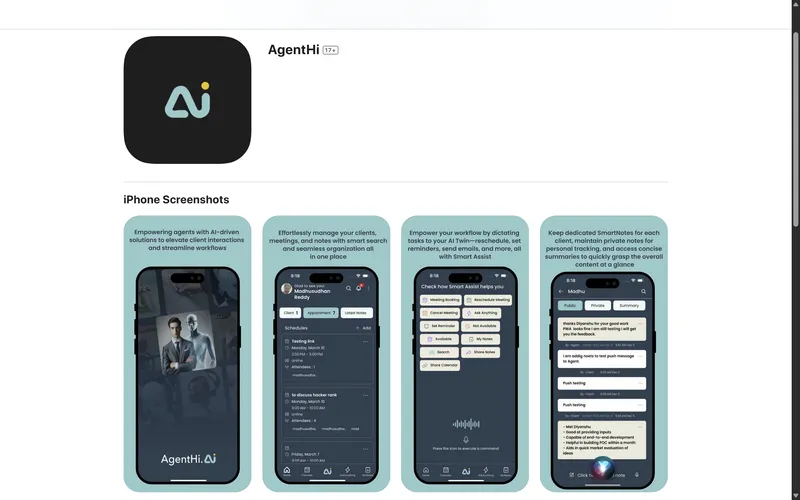
Intelligent virtual assistant that streamlines customer support and automates routine business tasks.
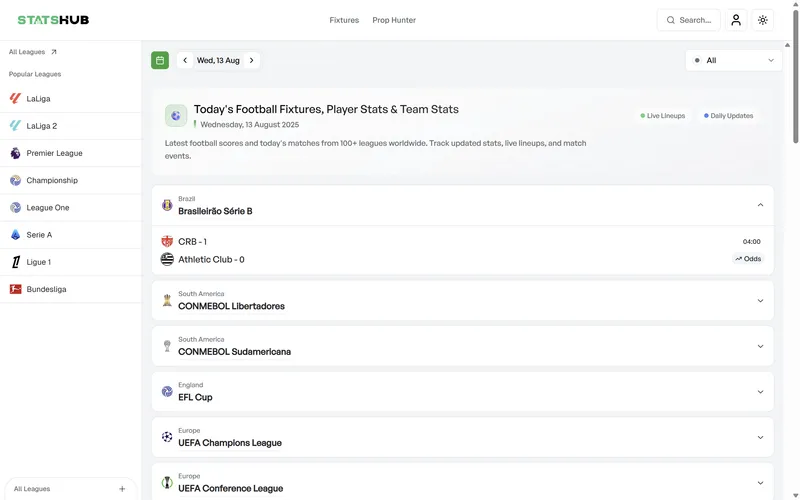
Comprehensive analytics dashboard providing real-time insights and data visualization for businesses.
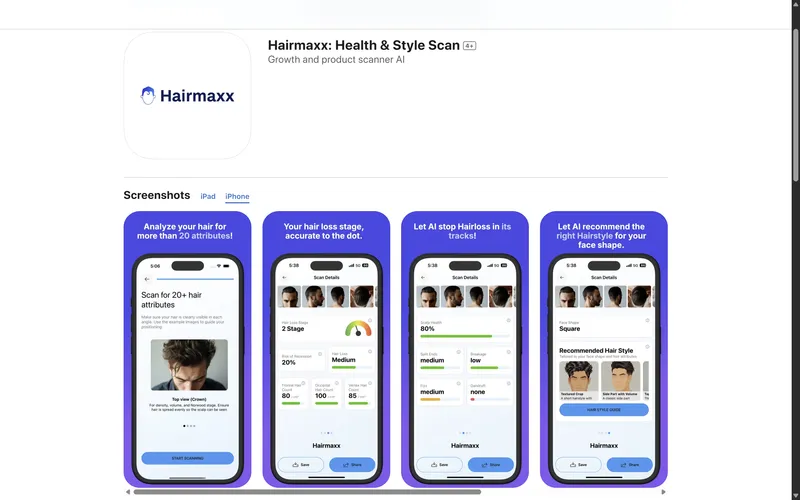
Personal fitness companion with AI-driven workout plans and nutrition tracking for optimal health.
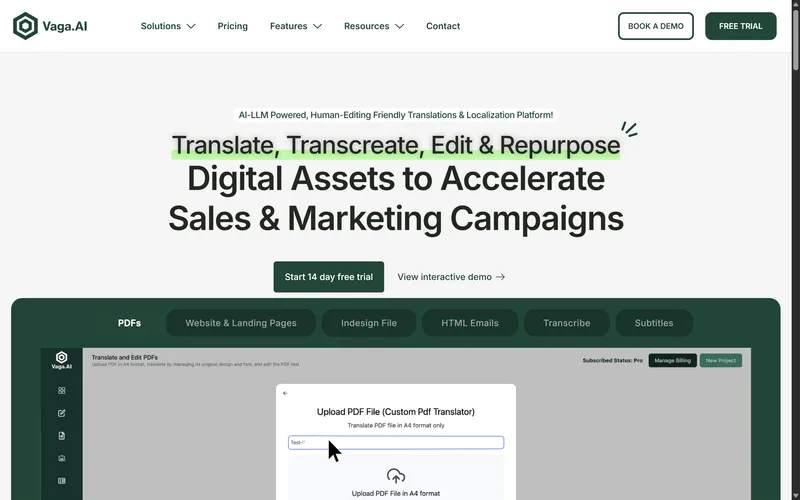
Smart travel planning app that curates personalized itineraries and local experiences.
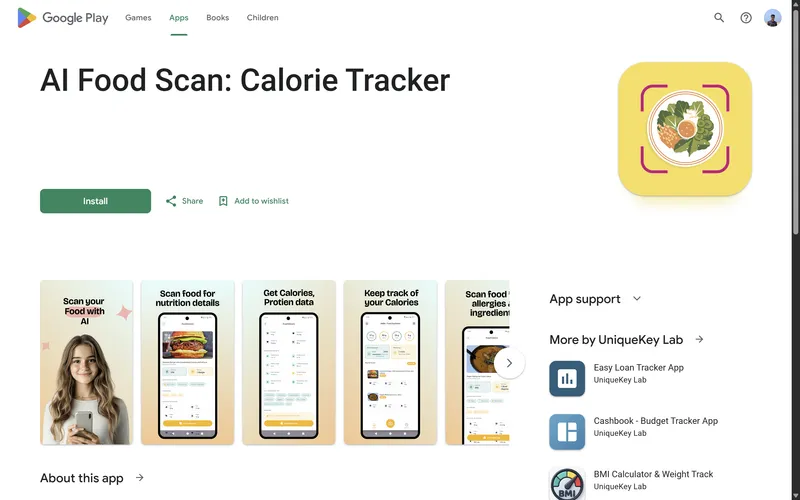
Nutrition analysis app that scans food items and provides detailed nutritional information instantly.
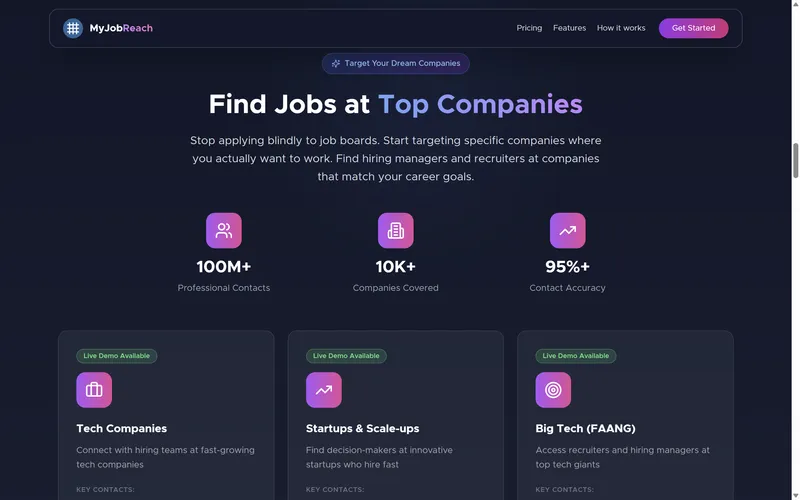
Job matching platform connecting talented professionals with their dream opportunities.
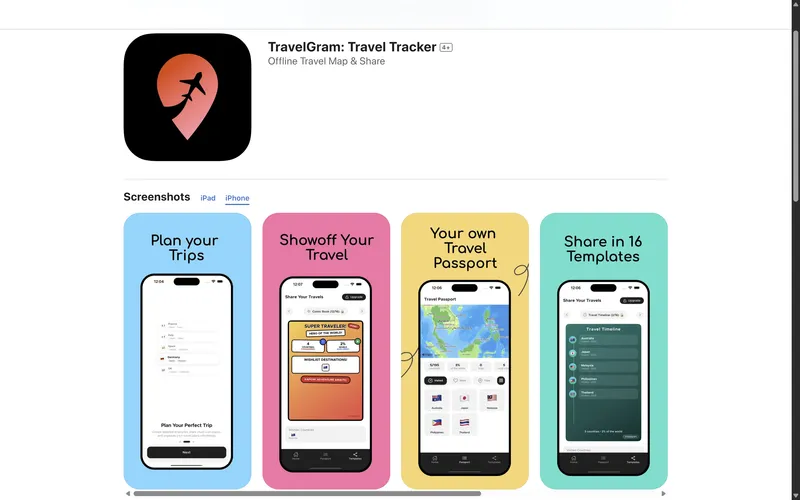
Social platform for travelers to share experiences, discover destinations, and connect globally.
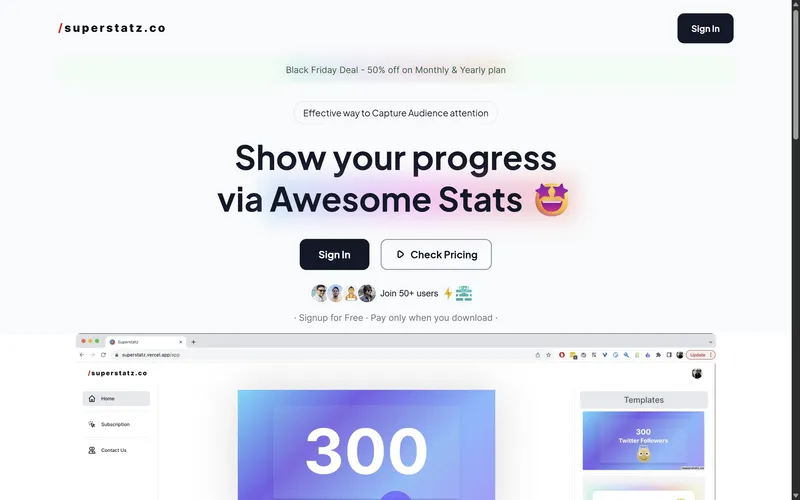
Advanced sports statistics platform delivering in-depth analysis and performance metrics.
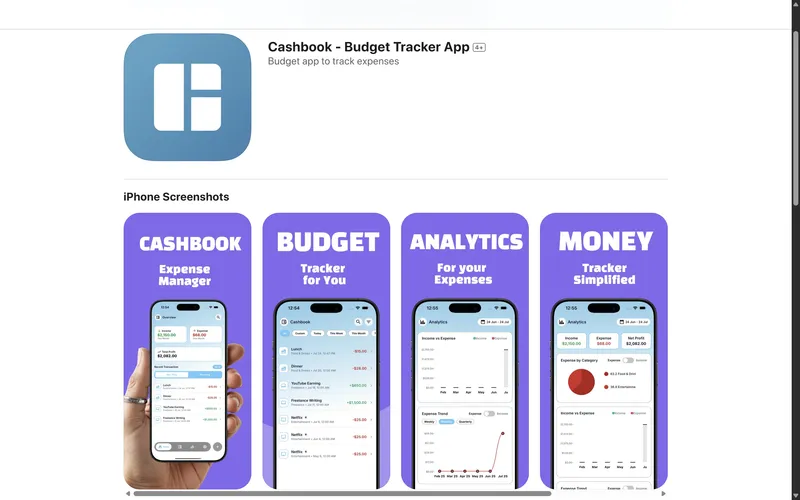
Simple expense tracking and budgeting app that helps users manage their finances effortlessly.
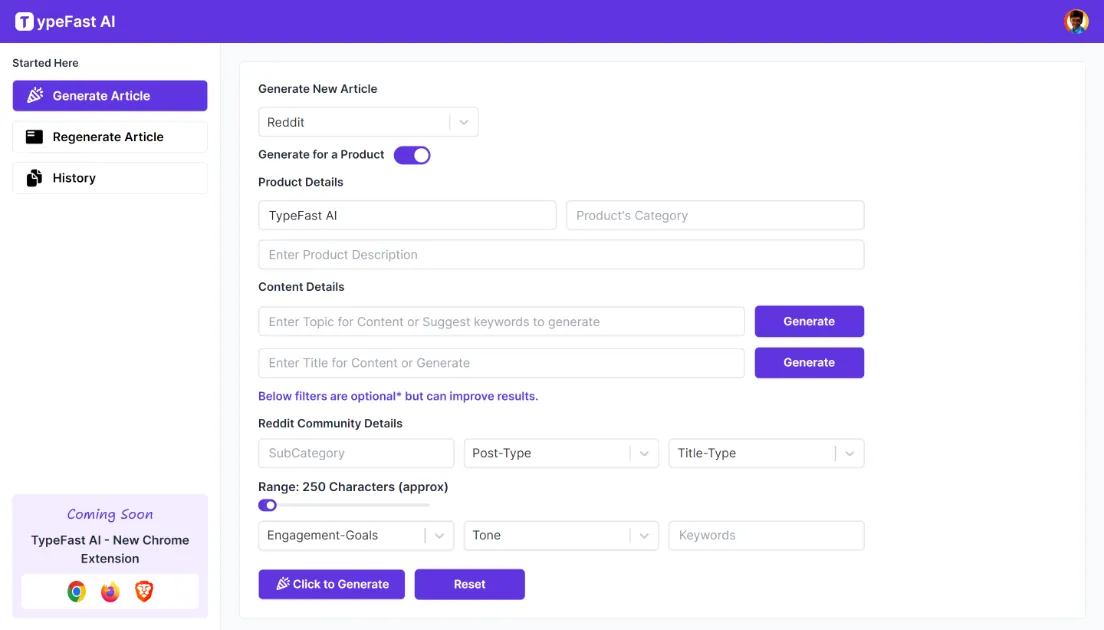
Typing speed improvement platform with gamified lessons and real-time performance tracking.
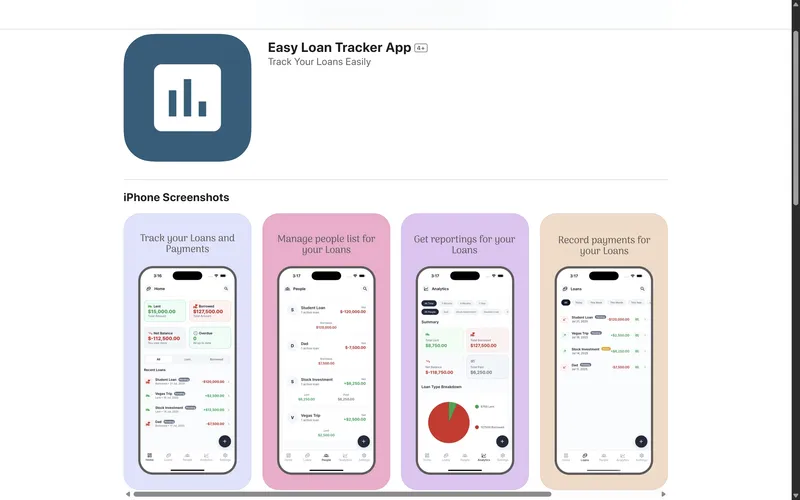
Streamlined loan management system that simplifies borrowing and lending processes.
Discover more services, technologies, case studies, and resources
Know exactly how users interact with your AI product from Day 1. We set up PostHog, Mixpanel, or custom analytics with event tracking, funnel analysis, and AI-specific metrics that drive product decisions.
Get investor-ready in 2 weeks. We build the metrics dashboards, analytics infrastructure, and KPI documentation investors expect to see during due diligence, so you never fumble a data question in a pitch.
SpeedMVPs delivers Design Audit in 2-3 weeks. Production-ready implementation by a specialist AI engineering team.
Build a unified design system that makes your product consistent, your team faster, and your UI code maintainable at scale. Figma component library, React component implementation, Storybook documentation: one source of truth for design and code.
Schedule a complimentary strategy session. Transform your concept into a market-ready MVP within 2-3 weeks. Partner with us to accelerate your product launch and scale your startup globally.